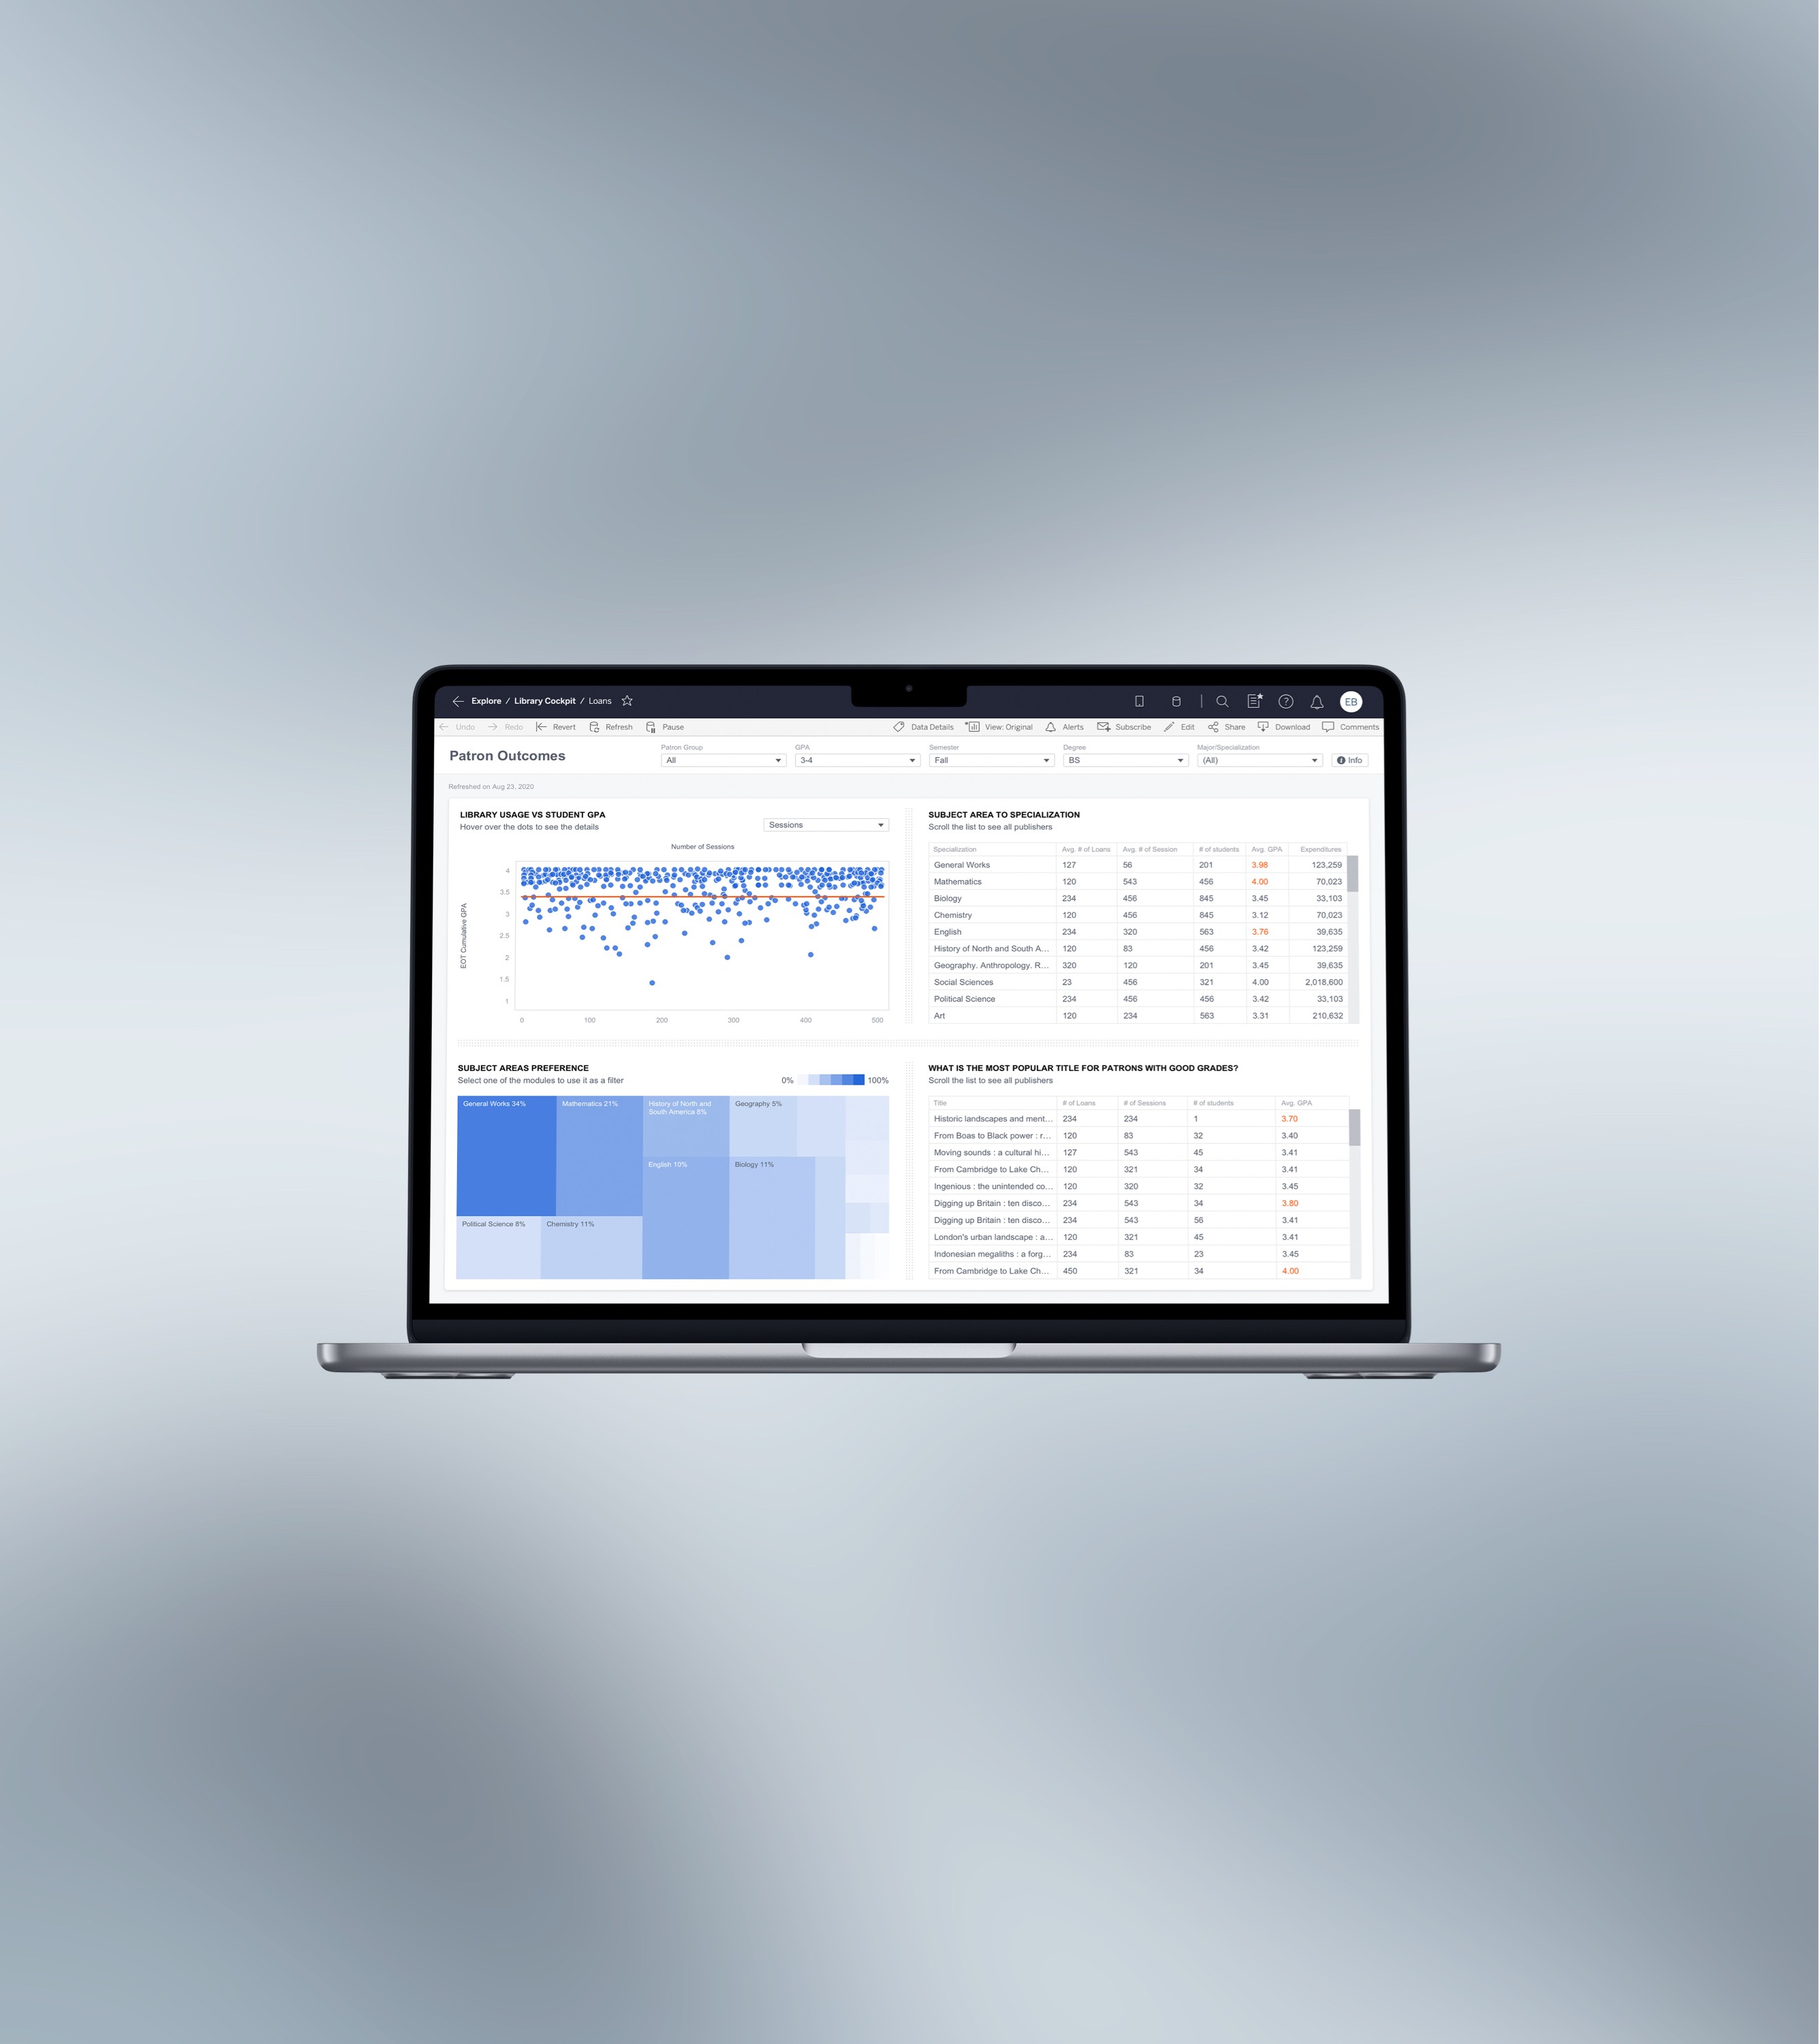
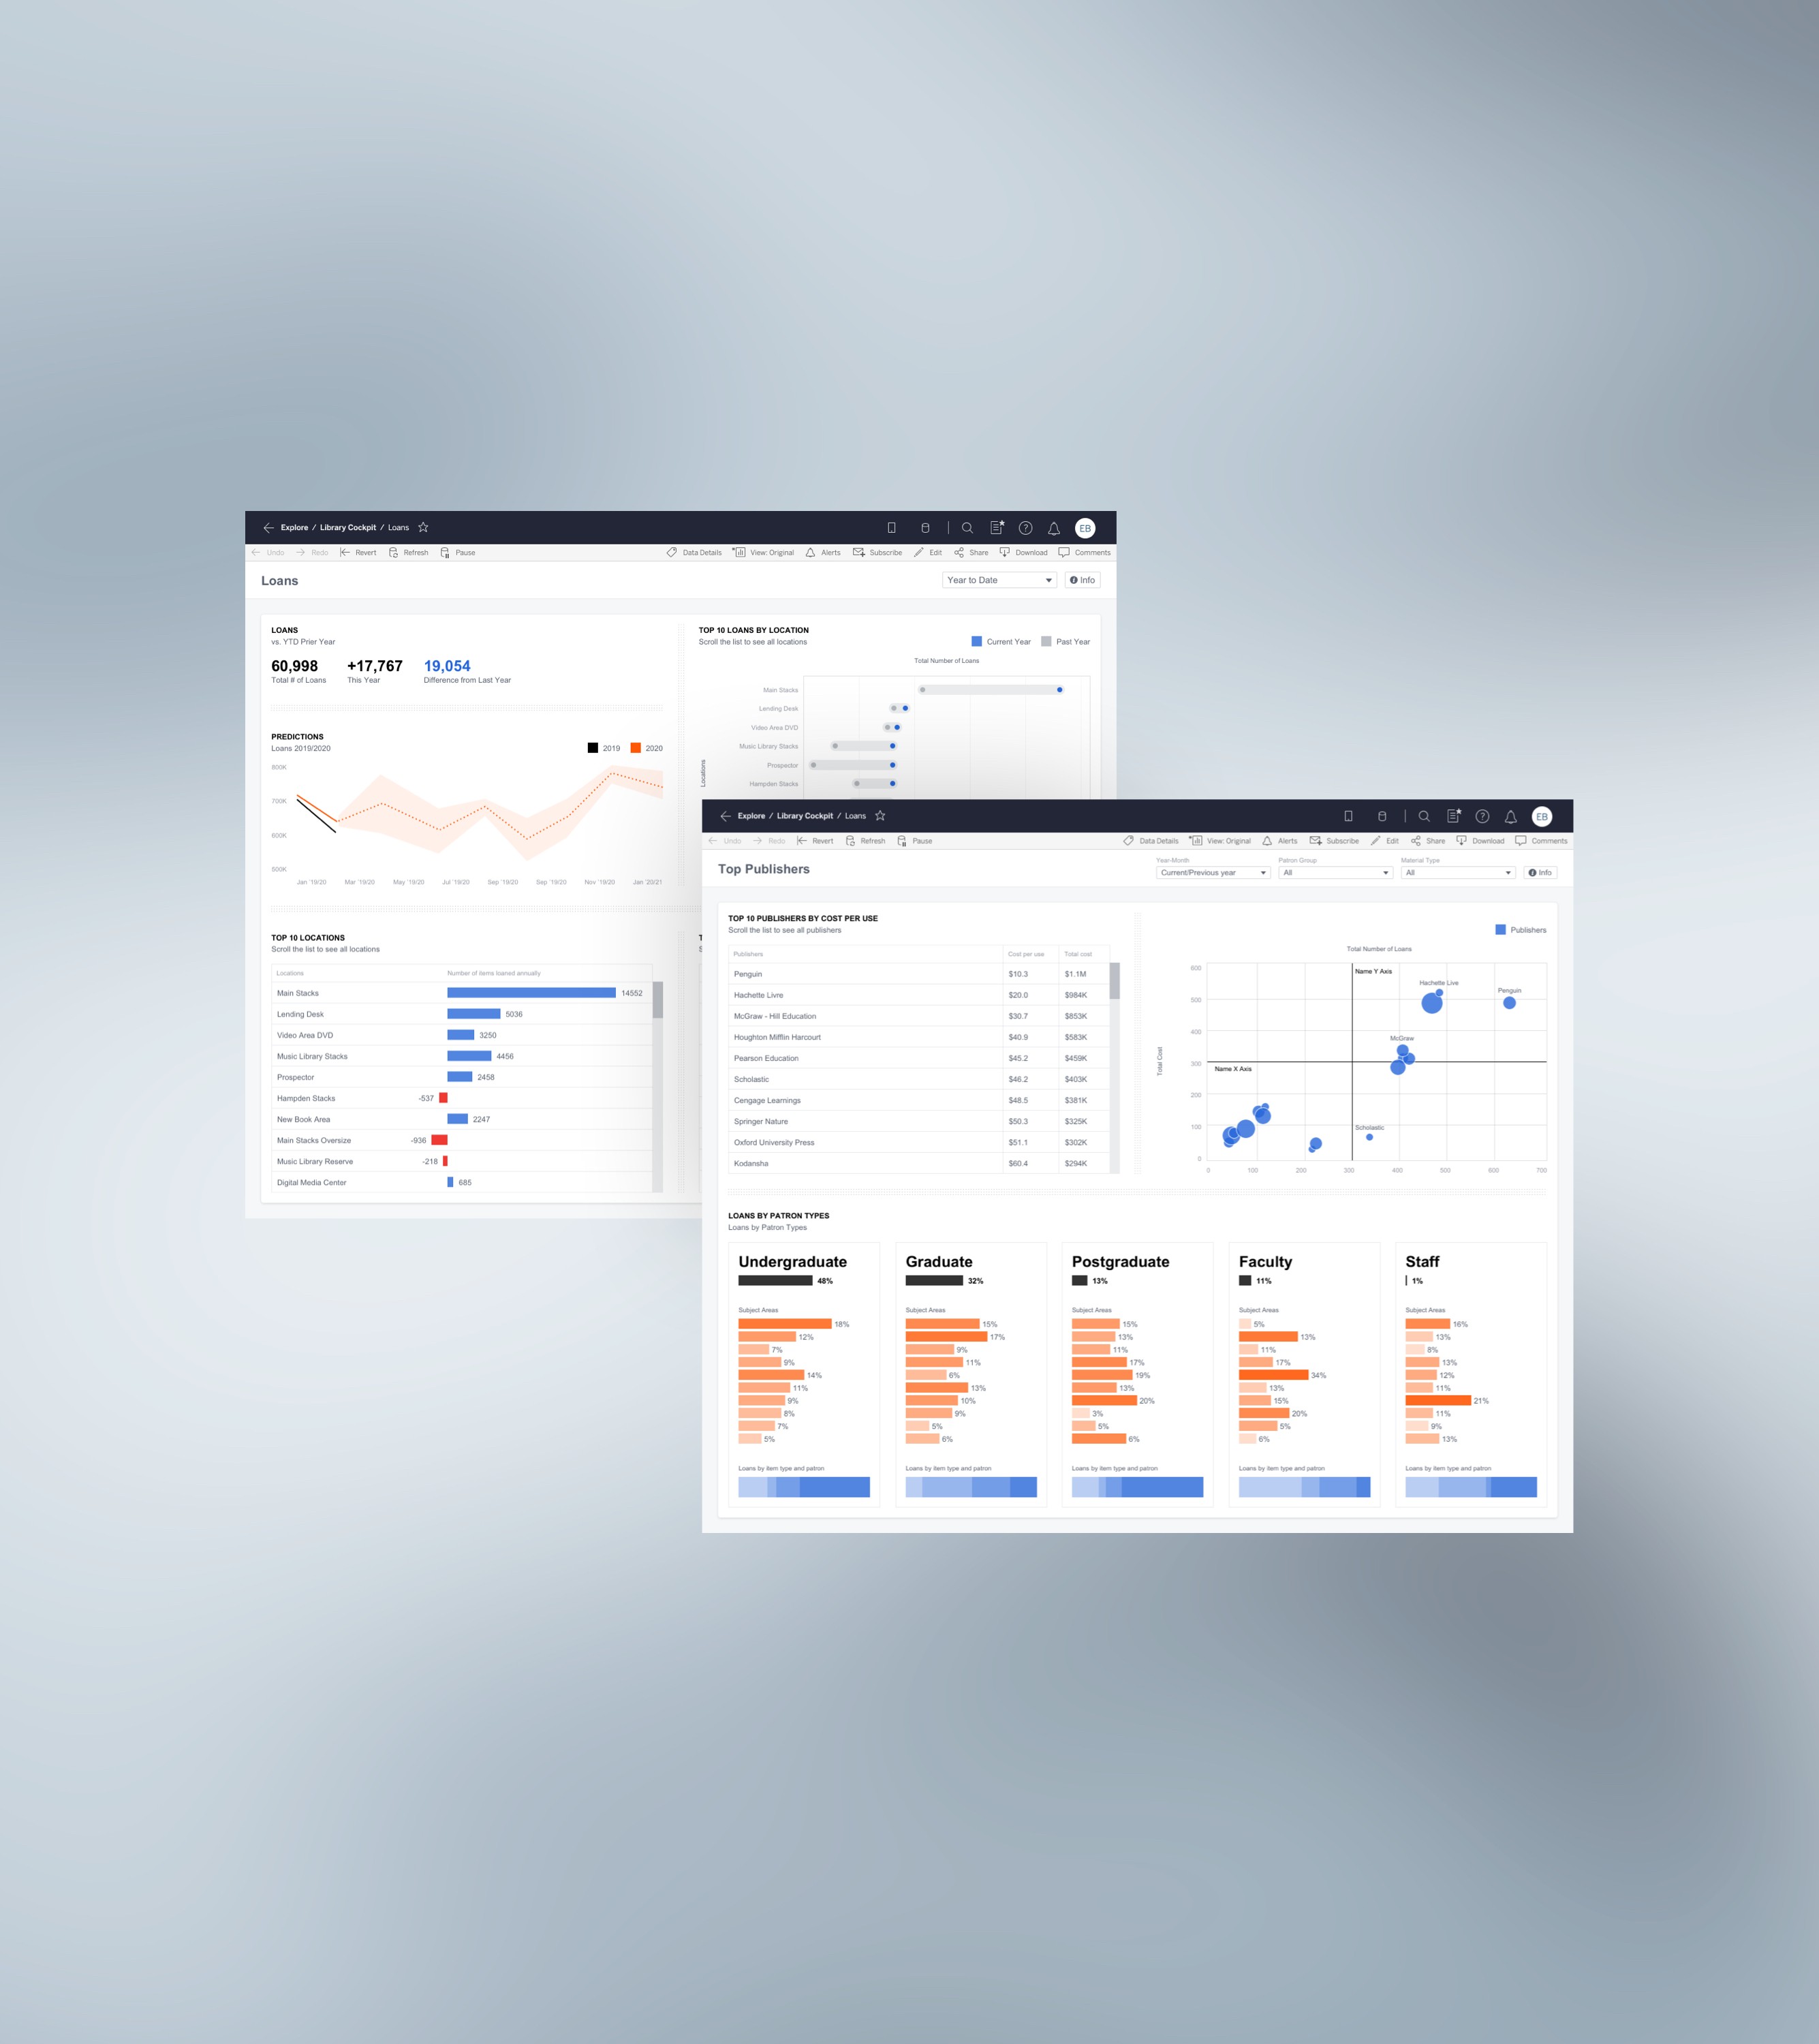
This project involves designing and implementing data visualization dashboards for academic libraries using Tableau, with a focus on university management staff activities.
University staff find it difficult to effectively monitor library analytics and make informed predictions for upcoming semesters due to a lack of intuitive, data-driven dashboards that clearly present trends, forecasting, and other relevant insights.
We have achieved an 80% user satisfaction rate with the dashboard interface within the first six months of deployment, as measured by user surveys.
Improved the accuracy of semester predictions by 18% within nine months, as tracked through historical data comparisons.
My role:
User research
Documentation
Workshops
Accessibility
UX/UI
Design iteration
Design handoff
Post-launch evaluation


